It is time for another update on Oil & Gas across the board. Firstly, I would like to
Start with the UK; it is no surprise we are seeing record breaking profits in this
sector. In fact, we were planning for this some 18 months ago, as we got
overweight Crude back in October 2020, when the spot prices were trending
around $40bbl. As we also diversified into our domestic E&P market (North Sea), super majors (BP), along with microcaps, many of these positions are still running today, and it has been by far our largest holding.
Now I would like to talk about a few new points I’m seeing across the O&G
sector globally. Going back last month the UK government introduced the
energy profits levy – a 25% surcharge on UK O&G sector profits. It also included
the all-important investment allowance of 80%, reducing the tax if
Corporations invest in O&G extraction in the UK. It is unclear when this levy will
be phased out, but is more than likely to be when prices normalize. The levy is
expected to collect around £5bn in 2022. Earnings for these companies are at
record levels; take our BP holdings, for example, which we got overweight from as early as September 2020 until as late as November 2021; the majority is still
active, with a total gain of just under aggregate 65%. I will say the company did
have a brief pullback during the escalating crisis in Ukraine; it gave BP the
reason to dispose of Russian Rosneft. Finding a buyer will be the tricky part as
for now, this remains on the balance sheet as an investment. The loss of Rosneft is still under that of the massive cash flows generated from raised O&G spot prices. Indebtedness is very much heading in the right direction, with surplus cash outpacing planned buybacks. These legacy companies have done very well for us, as BP is now approaching 400gbx. Again, the run from 200gbx has massively outpaced all other sectors, even with this being a blue-chip name. Even though we have clearly seen a reduction in capex, make no mistake, these companies are capital hungry; if new wells aren’t brought online, eventually fields dry up. So with the recent news from BP stating they will be focusing on heavily lower carbon assets, could this be a damper for the share in the near term? We highly doubt it.
Next we have the topic of EU oil moving away from the North Sea, it is not new
news that imports from Russia have been somewhat tapered in recent months. If an outright or planned severe reduction in Russian O&G imports does take place, what will this mean, and who is most vulnerable? One aspect to consider would be looking at nations like Hungary, Slovakia, and the Czech Republic; these all rely heavily on Russian imports. If these nations had to buy from other producing nations, this will be very problematic as the special relationships between Russia and these countries will be tested. They will also likely then be susceptible to enormous price hikes from other nations, essentially starting from scratch if trade relations came to that. With the country’s yearly deficit already widening, this will need an entire new re calibration. With the middle of Q2 showing a HUF 260bn deficit, sitting around 80% of the full-year cash flow based deficit target. No matter what data we see into the year-end, this screams weak. The biggest issue is trade balance. Being in a deficit for almost one year now, the value of imports is growing by 23% YoY, mainly due to the rising energy bill of the country. So even with relations with Russia keeping the same, the trade and current account balances show no sign of rebounding due to constrained export capacities. Because, of course, this doesn’t just touch the O&G markets; the damage can be felt much further into the FX markets. EUR/HUF has seen major headwinds since mid-April, bottoming around 370. The key factor in HUF weakness remains the continuous deterioration in the external balance due to the country’s rising energy bill (from Russia). A bet against the HUF is easier for investors at this time. It has even spread into the yield curve, with their domestic rate market remaining highly dependent on the mix of moves in their core rates.
Moving the conversation onto Russian oil and current trade flows. At the start of the year ,we actually saw very stable 1Q22 Russian oil production, contrary to
popular belief, since April this has been declining. Although Russia has stopped
disclosing its output, through various sources, the figure is expected to be around 10%. At the same time in 1Q22 the global market was broadly balanced, prior to the significant deficit we saw in 2021 caused by significant Covid demand and slow OPEC+ production increases. There has been a lot of talk about the market turning back into a surplus for YE22, but with reduced flows from Russia. I have a feeling this could be pushed back to 2023 keeping the market tight.

For context , in 2019 (a typical pre-pandemic year), Russia produced 11.5mbpd of oil (12% global output). Europe bought around 55% of Russia’s exports. Demand and consumption is almost back to pre-pandemic levels once again. During this uptick over the last 6-18 months, I have talked extensively about different economic producing nations vs. the importers, who rely heavily on cheaper spot prices to stop FX current accounts from being drained.
(I have once again attached out views on some of these nations; take particular note of Turkey.)
USD/TRY – After the recent surge dating back to the end of December and into
January, this pair has really been in consolidation since the second week of
January. Yet, the daily % swings are still impressive vs. previous performance before volatility really picked up back in early November, now any
move is dwarfed in comparison to the starting swing of 1USD-8TRY and
beyond. As we continue to monitor emerging markets with particular interest
In Turkey, there are a few pointers I would like to outline for the investors.
Inflation in Turkey increased by 11.1% MoM in January 2022, which pushed the annual figure to 48.7%. Given the recent upgrades from the CBT for YE inflation, it is now more than likely going to get revised again; something nearer to 50% true rolling inflation is what we will likely see. Remember, this is close to double the previous peak we saw in October 2018, which also saw TRY rapidly sell off. The Lira is perhaps one of the closest currencies to follow inflation in terms of real rates and domestic policy. With dated Brent having just hit $100 this week, I would argue that the roadshow is just starting for further TRY depreciation. As a substantial net energy importer, Turkey is really feeling the impact of soaring energy costs.
Turkey Import figures: 2021
Find the 2011 final figures for Turkey. Imports grew 29.9% vs. 2020 to a fresh record peak of $30Bn in December 2021, due to the purchase of intermediate and capital goods. The only sector that fell was imports of consumption goods, likely due to a nominal drop in wage growth and rising costs on household energy bills, which I mentioned in a prior update that the government is currently subsidising, which is why the recent move and loans into geothermal energy will be key for eventually slowing down the current account extreme spending. All of this we managed to navigate successfully via our short on TRY, and current longs cross the majority of the energy spectrum.
Now we are seeing several tail risks for at least an eventual slowdown in the oil
growth, these come in the form of several different sources of additional crude
supplies. The likes of Saudi Arabia and UAE have spare capacities of 2mbpd and 1mbpd, with the UAE sitting around 3mbpd they are on track for 5mbpd before 2030. In the Near-term, there is no commitment for these countries to ramp up output to compensate for losses coming out of Russian oil. I believe you will eventually begin to see the narrative change at OPEC+ meetings as hints grow for larger and larger production runs in the UAE.
Let us now move onto the LatAm market. We are seeing various exposure and
negative sentiment at the moment. With elevated energy prices, we are seeing
Cash flow being negatively hit on many of the utilities and majors here. As they
generally operate in countries that are net importers of crude oil, natural gas, or LNG. Only those that operate as a net exporter have seen growth. The majority have high exposure to the spot market prices, so high O&G prices are hitting hard. Nations that particularly stand out are from the likes of Mexico and Chile. Mexico is a net importer of LNG from the US, while Chile is a net importer of LNG, coal, and oil, with 46% of its installed capacity being thermal and primarily exposed to coal. As we broaden our investment horizon, I would also like to point out Peru, Argentina and Colombia as areas to watch closely. Peru is producing enough gas to support the domestic needs and is a net exporter of LNG, the same for Argentina, and Colombia. Now it is my belief that we have yet to have seen the growth translate into these regions vs. the more dominant DM producing nations that have been at the forefront of this growth trend. When looking at some of the EBITDA margins, there’s plenty of liquidity, mainly coming from contracted gas sales and exports of oil. A lot of these small name producers do not see much in the way of foreign inflows; aside from the local currency, this presents an interesting opportunity for investment if one is to assume O&G prices will stay elevated in the near term.
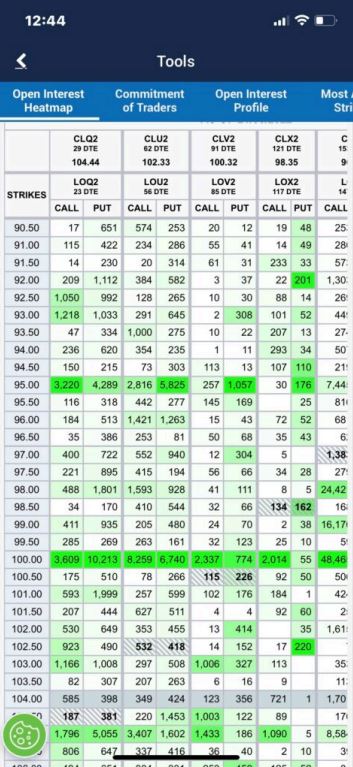
Here we have the latest OI for the relevant current market.
There appears to be significant selling pressure towards $100bbl in the near
term, with an almost 3:1 selling pressure of 3.6k Call / 10.2k Put. As we are quickly approaching $100blbl on CLQ2 this is an all-important level. As you can see we have already cleared out a lot of the vast puts every $1 over $100bbl. Though, if the market does dip below $100; we have very little in the way of open interest as the market has not been below $100 for some time now, with the last time being May. So we continue to watch for new developments sub $100; this will be crucial for setting up a new position in the coming weeks. If you begin to see clear signals of Calls under $100bbl this should provide some near-term stability; that is what we are watching for.
So what can we expect for spot oil prices going ahead? Well, considering we still have a variety of longs running from $40bbl, it is safe to say the near-term will remain elevated. Unlike the tech crash, these dips do present opportunities. The supply side-side constraints more than offset the impact of a potential recession. A trend, however, that is becoming wider is the recent scale-back in upstream projects that could quite literally lead to a supply crunch and actually drive prices higher. Total cash flows are approaching $1 trillion from listed producers for this year, but where is the money going? Only a small percentage is being reinvested upstream. Does this mean higher dividends and lower capital growth? With that logic, it would be far safer buying +$100bll oil vs. majors.
Another crucial sector at the moment is LNG; our exposure is far smaller than
crude but significant enough to actively monitor. I would like to talk about some
of the different grades and some of the spreads we are seeing from different
locations. During the main Crude run last year, we talked about the importance
of owning oil with proximity to various locations like the North Sea, Europe, etc.
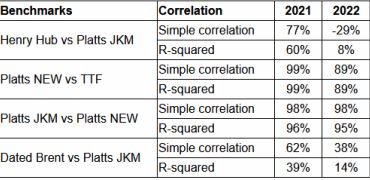
from a logistics point of view, dated Brent, etc. Now let’s look at LNG and some of the divergences. On the one side we have globally moving more or less in sync in a narrow band, yet when you look at certain tanks like Henry Hub and the Dutch Tile Transfer Facility, the divergence is much more apparent. We are watching Europe closely, with its move away from Russian gas.
The way to make money here, in our view, is through logistic constraints. TTF vs
Henry Hub recently closed in on $30/MMBtu looks to be mainly coming from
USA outages. You’ve already got issues in this market, where capacity utilisation at terminals is high, securing slots if getting costlier; this is a major factor in the recent sell-off for LNG import prices to Europe last month.
With the US exporting 30% more LNG so far YTD vs/ last year and already being
the largest producing nation, is this correlation about to start a pullback? It will
be very important for Europe and Asian LNG prices to keep within a similar
band, if this is not the case, expect some bumps in the road for these markets.
Really, as long as Europe has a strong need for spot LNG and North Asia demand remains, there would be more upward pressure on outright LNG and even EU gas hub prices.
Leave a Reply